

The following was written by Jock Finlayson, ICBA Chief Economist
Spending on goods and services – including housing – by families and individuals accounts for more than half of all economic activity in Canada. So, it makes sense to pay close attention to how Canadians manage their budgets.
Statistics Canada’s Survey of Household Spending provides some of the information needed to do that. The most recent survey was completed in 2021 and released a few weeks ago. The data for 2021 reflect the impact of the COVID-19 pandemic that started the year before.
How much households spend – and on what specific mix of goods and services – is of course partly dependent on incomes. Typically, those with higher incomes spend more in dollar terms and earmark a larger fraction of their budgets to “non-essentials” – categories such as leisure and entertainment, travel, health and personal care, and the purchase of durable goods like vehicles, furniture, and electronic products. Low- and moderate-income households generally allocate a large majority of their spending to “essentials” – shelter, food, transportation and household operations.
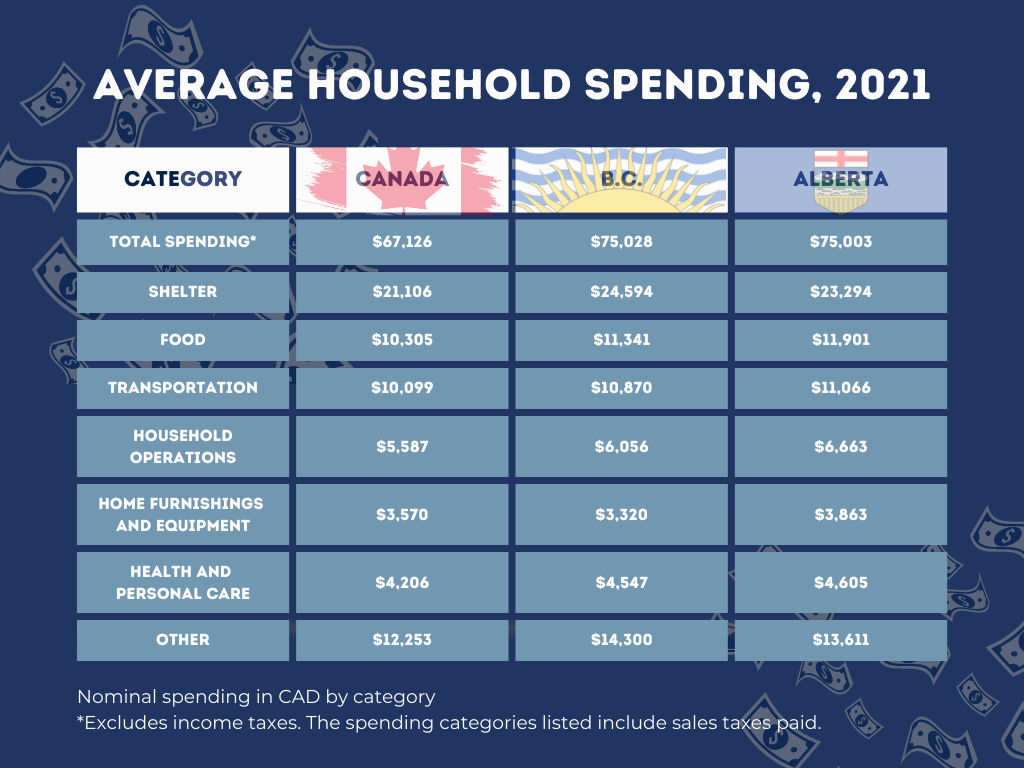
In 2021, Canadian households spent an average of $67,126 on goods and services, down slightly from 2019 – a reflection of the pandemic, which depressed demand for many services. (Households include single individuals as well as households consisting of two or more persons.) Adjusted for inflation, average household spending fell by 6.5% between 2019 and 2021. A decline of this magnitude over such a brief period has never been recorded since the data series began.
Note that the figures for spending on goods and services include sales taxes. Income taxes are not included in the above-noted figure for total household expenditures. In 2021, the average Canadian household paid income taxes of $18,181, representing about one-fifth of total expenditures and close to 30% of the amount spent to purchase goods and services.
The largest categories of goods and services spending are shelter (31.4% of total spending in 2021), food (15.4%), and transportation (15.0%). The impact of the pandemic was very evident in the transportation segment: reduced travel in 2021 led to a six-percentage point drop in the share of expenditures on goods and services devoted to transportation compared to 2019, with spending on air travel plunging by more than 70% and that on public transportation down by more than 60%. Spending on shelter/housing services, on the other hand, rose between 2019 and 2021, as did the amounts spent for home furnishings and communications services, including audio and home theatre systems, garden supplies, and exercise equipment.
Households in British Columbia ($75,028) and Alberta ($75,003) reported the highest average levels of spending on goods and services in 2021, with those in New Brunswick and Quebec spending the least. In B.C.’s case, the comparatively high cost of shelter/housing was a factor driving up expenditures. Albertans shelled out more than residents of other provinces on transportation.
As average incomes are significantly higher in Alberta than in B.C., it may be surprising that the two provinces reported almost identical average household spending. This can be partly explained by the fact that average household savings are lower in B.C. Moreover, for British Columbia homeowners, the high and rising value of residential real estate has had a notably positive impact on net worth, enabling many people to borrow against the equity in their homes to help finance current consumption.
This table summarizes average household spending for Canada, B.C., and Alberta in 2021, as well as the amounts spent in the principal expenditure categories:
When the next survey is released – covering calendar year 2023 – we are likely to see some “normalization” of spending patterns as the pandemic has receded. However, continued increases in the cost of housing and the sharp jump in inflation over 2022-23 can be expected to show up in the data on household spending behaviour.